
Photo by Luke Chesser on Unsplash
Datadog vs Grafana: A Comprehensive Comparison for Effective Monitoring
Understanding the Differences and Similarities Between Datadog and Grafana for Optimal Monitoring


Introduction
Datadog and Grafana are both popular tools for monitoring and visualizing metrics in real-time, but they have some key differences.
Datadog is a proprietary software platform that frequently releases a set of new features. Datadog has is a strong focus on infrastructure monitoring, which includes features such as tracing, log management, and APM (application performance monitoring). This can be particularly advantageous for organizations that rely heavily on cloud-based infrastructure and microservices, as it provides a holistic view of the entire system and allows for more effective troubleshooting and optimization. It is a completely cloud-based solution and does not offer the hosting of an on-prem solution.
Grafana is an open-source platform that is free to use and distribute under Apache License 2.0. This means that you can download and use Grafana without paying any licensing fees or costs. However, there are some additional features and plugins that are available in Grafana Enterprise, which is a commercial version of Grafana that requires a paid subscription. Grafana Enterprise includes features such as alerting, enhanced security, and support for large-scale deployments, as well as access to official plugins and technical support from the Grafana team. If you require these features, you will need to purchase a Grafana Enterprise license.
Datadog is a comprehensive monitoring and analytics platform that allows you to collect, visualize, and alert on metrics, traces, and logs from your infrastructure and applications. It offers a wide range of integrations with popular services and frameworks, including cloud platforms, databases, web servers, and more. Datadog also provides machine learning-based anomaly detection and forecasting, as well as collaboration and automation features.
On the other hand, Grafana is an open-source platform for visualizing time-series data. It allows you to create interactive dashboards with real-time graphs, panels, and alerts based on data from various sources. Grafana supports a wide range of data sources, including popular time-series databases, cloud platforms, and custom APIs. Additionally, Grafana has a strong community of contributors who have developed a variety of plugins and extensions that can be used to customize and extend its functionality.
Comparison based on some evaluation factors
Both Datadog and Grafana are powerful tools with unique features and strengths, and the choice between them ultimately depends on factors such as the complexity of the environment being monitored, the data sources being used, the need for customization, and the level of collaboration and automation required. It's important to carefully evaluate the specific requirements of your project and compare the features and capabilities of each tool to determine which one would be the best fit for your needs.
Functionality: Datadog offers a comprehensive monitoring platform with built-in features for anomaly detection, forecasting, and machine learning-based analytics. Grafana, on the other hand, is a more flexible and customizable visualization tool that can be used with a wide range of data sources and platforms.
Ease of use: Both Datadog and Grafana have well-designed interfaces and clear documentation, but Grafana has a stronger community and more resources available, such as tutorials and plugins, to help users get started.
Customization: Grafana is more customizable than Datadog, allowing users to create custom dashboards, panels, and data sources, and integrate with a wide range of third-party plugins and tools. Datadog, however, offers a more integrated and comprehensive platform with built-in features for monitoring and analytics.
Performance: Both Datadog and Grafana are performant and scalable, but Datadog has a more robust architecture and can handle larger volumes of data more efficiently.
Cost: Datadog is a more expensive solution than Grafana, with pricing based on the number of monitored hosts, while Grafana is an open-source platform that is free to use and distribute.
Security: Both Datadog and Grafana have strong security features and protocols in place to protect sensitive data and prevent unauthorized access or breaches.
Overall, Datadog is a more comprehensive and integrated monitoring platform with advanced features for anomaly detection, forecasting, and machine learning-based analytics, while Grafana is a more flexible and customizable visualization tool with a strong community and support for a wide range of data sources and platforms. The choice between Datadog and Grafana ultimately depends on the specific needs and requirements of the project, such as the complexity of the environment being monitored, the data sources being used, and the level of customization and integration required.
Three key differences where Grafana is better than Datadog:
Customizability: Grafana is highly customizable and flexible, allowing users to create and customize their dashboards and panels using various data sources, plugins, and visualization options. Grafana's flexible panel editor allows for easy customization of the visualization of the data, including adding custom visualizations or manipulating existing ones. Datadog, on the other hand, provides a limited set of visualization options and customization capabilities.
Open-Source: Grafana is open-source, which means users have access to its source code and can contribute to the development of the platform. This makes it possible to build custom integrations, plugins, and extensions, as well as to use Grafana without any licensing fees. In contrast, Datadog is a proprietary platform with closed-source code and a subscription-based pricing model.
Support for non-time series data: While both platforms excel at visualizing time-series data, Grafana supports a broader range of data sources, including relational databases, NoSQL databases, and other data sources that don't necessarily have a time-series structure. This makes Grafana a more versatile tool for visualizing a wider range of data types, while Datadog focuses more on monitoring and analyzing time-series data.
Three key differences where Datadog is better than Grafana:
Comprehensive Monitoring Platform: Datadog is a comprehensive monitoring platform that provides a unified view of your infrastructure, applications, and logs. It offers a wide range of integrations with popular services and frameworks, allowing you to monitor all aspects of your environment in a single platform. In contrast, Grafana is primarily a visualization tool and doesn't provide the same level of monitoring capabilities as Datadog.
Out-of-the-box integrations and features: Datadog comes with a wide range of integrations and features out-of-the-box, including machine learning-based anomaly detection, customizable alerts, and customizable dashboards. These features make it easy to get started with monitoring and analyzing your data without the need for extensive setup or customization. Grafana, on the other hand, requires more configuration and setup to get started with monitoring.
Collaboration and automation features: Datadog provides robust collaboration and automation features, including team collaboration, role-based access control, and automated remediation actions. These features enable teams to work together effectively to resolve issues and automate common tasks. While Grafana supports some collaboration and automation features, it is not as extensive as what Datadog offers.
Conclusion
Datadog's comprehensive monitoring platform, focus on infrastructure monitoring and robust architecture make it an attractive option for organizations that need to monitor and analyze large and complex environments with a wide range of metrics and data sources.
Overall, the flexibility, customization capabilities, and open-source nature of Grafana make it an attractive option for organizations looking for a powerful and customizable visualization tool.
In conclusion, both Datadog and Grafana are powerful tools for monitoring and visualizing metrics in real time. They have different strengths and weaknesses, and the choice between them depends on the specific requirements of the project. Datadog is a more comprehensive monitoring platform with built-in features for anomaly detection and forecasting, while Grafana is a more flexible and customizable visualization tool with a strong community and support for a wide range of data sources. For machine learning projects, Datadog may be more useful due to its machine learning-based features, while Grafana can be useful for visualizing metrics generated by machine learning models or workflows.
Ultimately, the choice between Datadog and Grafana for machine learning projects would depend on the specific requirements of the project and the tools being used. If your project requires extensive machine-learning capabilities, it may be better to look for specialized machine-learning tools or platforms. However, if you are already using Datadog or Grafana for monitoring and visualization, they can be useful for adding some machine learning-based features to your workflows.
Datadog was the "Leader" in the Magic Quadrant for Application Performance Monitoring and Observability published in June 2022.
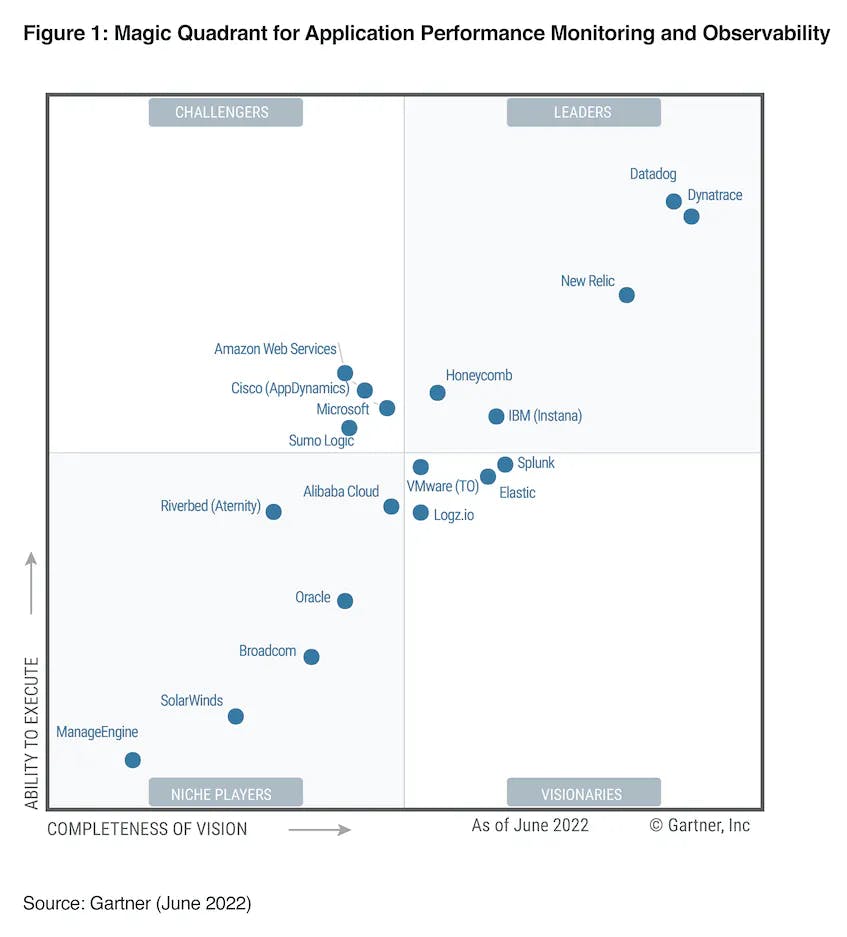
Source: https://www.gartner.com/doc/reprints?id=1-2A8RQQW4&ct=220608&st=sb